jlion.com
Home
Privacy
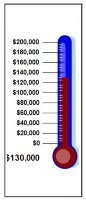
Thermometer Chart (HTML)
Generate thermometer chart images
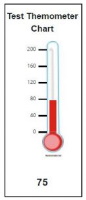
Thermometer Chart (Javascript)
Embed a thermometer chart into your site